S1E1 - Marks and Encoding
Let’s learn to run before we fly 🕊️ — a walk-through of the fundamental building blocks in Vega-Lite data viz development
💌
PBIXfile available at the end of the article 1 Enjoy!
Acknowledgements
Before we begin, I’d like to tag and thank Deneb creator Daniel Marsh-Patrick — you can find comprehensive Deneb resources and examples at the offical website: deneb-viz.github.io. Daniel has inspired innumerable Power BI developers around the world, enabling us to go far beyond the boundaries of “traditional” Power BI report design. This article is a celebration of Daniel’s endeavours, for which I owe my sincere gratitude 🤓🙌
Getting Started
When embarking on any new learning journey, it’s only natural that we want to create the most amazing, dazzling designs. However, despite our eagerness to unlock new skills and talents, it is absolutely necessary to begin by taking baby steps 🐣… and Vega-Lite is no exception.
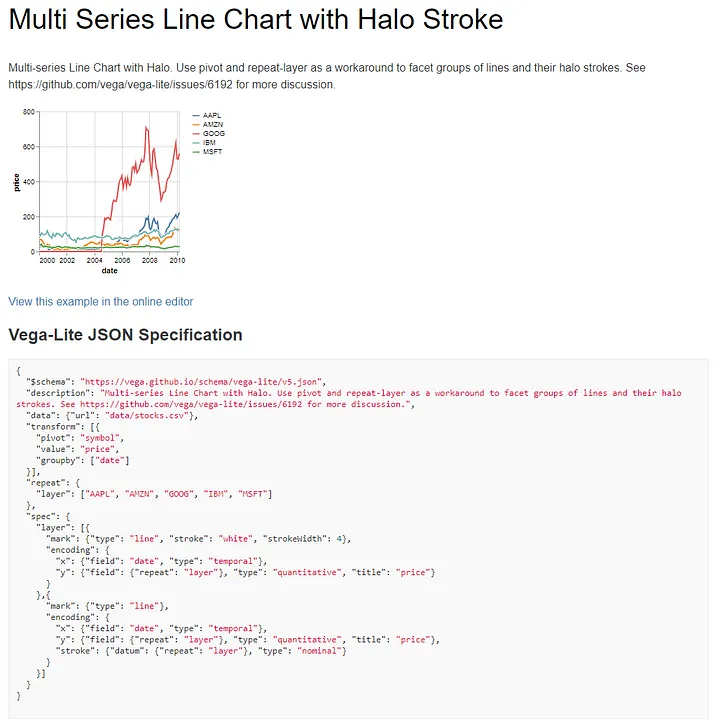
It can at first be overwhelming, particularly when viewing the Vega-Lite examples gallery
I know what you are thinking:
“But I just want to make a simple line chart 😭… what happened to my clicky-clicky-draggy-droppy experience?!”
Well, Vega-Lite is incredibly powerful and versatile… but it does require some extra effort. In order to put our chart design ideas into practice, we must get to grips with JSON, and Vega-Lite’s grammar and syntax. It will enable you to build charts which overcome many of the limitations we find in native Power BI visuals. Are you ready to get stuck in? 🧙♂️
Step 1: Marks and Encoding
Using the PBIX solution file as a guide, let’s go through the step-by-step process. First, we want to build the dataset for our Deneb visual.
Add the Deneb visual to the canvas Add the [Category] field and [AC] measure to the Values bucket Click on the elipses […] and “Edit” Select “Vega-Lite” specification, and the “empty (with Power BI theming)” template Create! 📊

Create your first Deneb Vega-lite spec
Step 2: Create a Mark
You will be presented with an empty template which will contain the following specification:
starting spec
1
2
3
4
5
6

{
  "data": {"name": "dataset"}, // PowerBI dataset
  "layer": []                  // Empty layer attribute (no marks)
}
infoFrom Deneb version ~> 1.7.0 onwards, comments can be written in the JSON spec.
What we need to do next is “assign” specific parts of our dataset to the chart canvas using a choice of geometric shapes which we refer to as marks.
For this exercise, we will apply a bar mark. I have annotated each line to describe the Vega-Lite structure and grammar:
add bar mark
1
2
3
4
5
6
7
8
9
10
11
12

{                               //-- specification start
  "data": {"name": "dataset"},    // powerbi dataset
  "layer": [                        // start layer
    {                                 // start mark (inside curly brackets)
      "mark": {                         // start mark attributes
        "type": "bar"                     // mark type (bar)
      }                                 // end mark attributes
    }                                 // end mark
  ]                                 // end layer
}                               //-- specification end
The resulting chart will look like this:

First Bar Chart
Wait, what? Where’s my bar chart? 🤔

First Bar Chart
Althrough we’ve created a bar mark, it has not bound the graphical property to any axis. This is where encoding comes in. For now, we will look at the x-axis and y-axis.
Step 3: Encoding Below, I’ve added the encoding channel to the specification.
encode mark
1
2
3
4
5
6
7
8
9
10
11
12
13

{
  "data": {"name": "dataset"},
  "encoding": {},                  // empty encoding channel
  "layer": [
    {
      "mark": {
        "type": "bar"
      }
    }
  ]
}
Now remember our dataset field values?

data fields
We want to bind and define these data fields against the x and y-axis. Let’s first bind our Category field to the y-axis:
bind mark to y-axis
1
2
3
4
5
6
7
8
9
10
11
12
13
14
15

{
  "data": {"name": "dataset"},
  "encoding": {
    "y": {"field": "Category"}     // bind the "Category" field to the y-axis
  },
  "layer": [
    {
      "mark": {
        "type": "bar"
      }
    }
  ]
}
Here is the result:

bar mark bound to the y-axis
Looking better, but it’s not quite finished. Our x-axis is still undefined. Let’s fix that in a jiffy… returning to our specification:
bind x-axis
1
2
3
4
5
6
7
8
9
10
11
12
13
14
15
16

{
  "data": {"name": "dataset"},
  "encoding": {
    "y": {"field": "Category"},    // Category field on the y-axis
    "x": {"field": "AC"}           // AC measure on the x-axis
  },
  "layer": [
    {
      "mark": {
        "type": "bar"
      }
    }
  ]
}

bar mark bound to the y-axis
Hmmn, this isn’t what we expected, is it? Vega-Lite just needs a little help understanding what type of data this is that we are binding to the axis. For example, is it nominal, ordinal or quantitative?
The [AC] measure is a quantitative value, i.e. we want to aggregate/summarise it. Let’s make a little addition to our code:
define data types
1
2
3
4
5
6
7
8
9
10
11
12
13
14
15
16
17
18
19
20
21
22

{
  "data": {"name": "dataset"},
  "encoding": {
    "y": {
      "field": "Category",    // y-axis field [Category]
      "type": "nominal"       // data type = "nominal"
    },
    "x": {
      "field": "AC",          // x-axis field [AC]
      "type": "quantitative"  // data type = "quantitative"
    }
  },
  "layer": [
    {
      "mark": {
        "type": "bar"
      }
    }
  ]
}
Now run the code again and take a look… much better!

a proper bar chart
Congratulations, you have successfully built a beautiful bar chart. We’re almost finished. Here are a few bonus tips and quality of life techniques you can use to jazz up your designs.
Step 4: Bonus techniques to perfect your chart Firstly, our bar chart is sorted alphabetically by default. We can change the sort order of the y-axis in a very simple step:
1
2
3
4
5
6
7
8
9
10
11
12
13
14
15
16
17
18
19
20
21
22
23
24

{
  "data": {"name": "dataset"},
  "encoding": {
    "y": {
      "field": "Category",
      "type": "nominal",
      "sort": "-x"              // sort descending by the x-axis
     // "sort": "x"             // sort ascending
    },
    "x": {
      "field": "AC",
      "type": "quantitative"
    }
  },
  "layer": [
    {
      "mark": {
        "type": "bar"
      }
    }
  ]
}

sort axis
Finally, for that extra finesse 🪄, let’s add a splash of colour:
1
2
3
4
5
6
7
8
9
10
11
12
13
14
15
16
17
18
19
20
21
22
23
24
{
  "data": {"name": "dataset"},
  "encoding": {
    "y": {
      "field": "Category",
      "type": "nominal",
      "sort": "-x"
    },
    "x": {
      "field": "AC",
      "type": "quantitative"
    }
  },
  "layer": [
    {
      "mark": {
        "type": "bar",
        "color": "teal"      // update the mark's color attribute
     // "color": "#0000FF"   // use hex codes or CSS colour schemes
      }
    }
  ]
}
. . .
En Fin, Serafin
Thank you for staying to the end of the article… I hope you find it useful 😊. See you soon, and remember… #StayQueryous!🧙♂️🪄
PBIX 💾
🔗 Repo: Github Repo PBIX Treasure Trove

. . .
Footnotes
PBIX: Repo - Walkthrough Series ↩︎